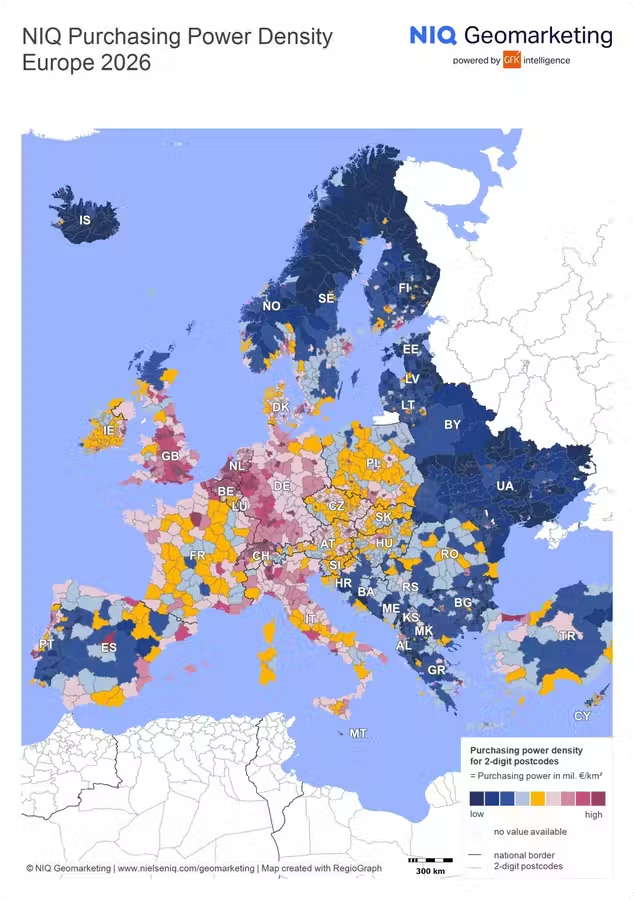
Per capita purchasing power in Europe rises to €21,153 in 2026, a nominal increase of 4.4%. Romania drops to 32nd place in the European ranking, with €11,283 per capita, equivalent to approximately 53% of the continental average. [1]
As the story develops
Update
Housing crisis and purchasing power: A comprehensive approach to the real estate market and household budgets in Europe
The NIQ study 'Purchasing Power Europe 2026' reveals a structural shift in the hierarchy of purchasing power on the continent: Romania has dropped to 32nd place in a ranking of 42 European states, with an estimated disposable income of €11,283 per inhabitant in 2026. This amount is equivalent to approximately 53% of the European average of €21,153, marking a loss of one position compared to the previous edition of the ranking. The analysis provides a detailed snapshot of regional disparities, explaining major divergences within the country. At the European level, average purchasing power grew nominally by 4.4% compared to the previous year, reaching €21,153 per person. The total sums available for expenditure and savings of the European population are estimated at €14.5 trillion, reflecting a relative stabilization of the global indicator. The European ranking of relative wealth remains dominated by Liechtenstein (€78,520 per capita), followed by Switzerland (€54,730) and Iceland (€44,692). Luxembourg occupies fourth place, while Norway climbs spectacularly to fifth place with €35,947, surpassing countries that were previously at the top. The opposite pole of the classification is occupied by Ukraine, with a disposable income of €3,456 per inhabitant, the last among the 42 evaluated states. Kosovo and the Republic of Moldova also stand out with the lowest values, highlighting economic disparity in the southeast of the continent. The overall structure of purchasing power in the EU indicates that only 17 countries exceed the continental average, while the remaining 25 states fall below this threshold, accentuating inequalities in economic development. [2]
Romania exhibits one of the most acute internal divisions regarding incomes. The Bucharest-Ilfov region records a purchasing power of €22,941 per inhabitant, a level double the national average of €11,283. The capital manages to cross the European threshold; Bucharest is the only administrative-territorial unit in Romania that exceeds the EU average of €21,153 per person, consolidating its status as a major economic hub. The European purchasing power index calculated for Bucharest is 108.5, exceeding the continental standard. The national index, which measures deviation from the country's average, reaches 203.3, clear proof that income in the capital is more than twice the national average. In the internal hierarchy, after Bucharest, the counties of Cluj, Ilfov, and Timiș record the highest national index values, followed by Sibiu, Brașov, Prahova, Argeș, and Constanța. In total, these nine counties and the Bucharest metropolitan area constitute the only points of resonance above national averages. The transition to the area below the country's average is easy, with Alba occupying 10th place in the internal ranking with a national index of 99.3, signifying that the threshold of the national average is extremely tight around this group of developed areas. The abyss between the top and bottom of the national ranking is visible in absolute numbers. Besides Bucharest, which records €22,941, the Giurgiu county reaches only €5,816 per inhabitant, highlighting a strong development gap within the borders. The value discrepancy reaches €17,100 between the capital and Giurgiu, purchasing power in Bucharest being nearly four times higher. This regional fracture indicates an extreme concentration of available financial resources. The model of concentrating incomes in capitals is not unique to Romania, but a generalized European model. Paris records €46,366 per capita, approximately 80% above the French average. Similarly, Bratislava, Sofia, Prague, Budapest, and Lisbon exceed their respective national averages by at least 25%. However, the existence of exceptions demonstrates that regional harmonization is possible. Berlin records a purchasing power of €30,178, placing it over €1,000 below the German average (€31,193). Similarly, in Brussels, the local level is approximately 10% below the national average, suggesting alternative models of wealth distribution. NIQ's methodology is based on the purchasing power index as the sum of post-tax and post-contribution disposable incomes, supplemented with social benefits received from the state. This definition includes all resources destined for current expenditure and savings, offering a nuanced image of household economic reality. The resulting purchasing power covers the full spectrum of daily and seasonal needs: food, housing, energy, transport, insurance, private pensions, holidays, and purchases of consumer goods, reflecting real economic absorption capacity. The estimated value for Romania of €11,283 represents a nominal indicator, not adjusted for inflation, calculated based on reported incomes, social benefit statistics, and current economic forecasts, providing a snapshot at a given moment. It is crucial to distinguish between the estimated disposable income, according to the NIQ study, and the actual amount spent or the standard of living measured strictly by prices. The indicator targets the financial potential of each resident, not concrete consumption behavior. [2]
Update
Housing crisis and purchasing power: A comprehensive approach to the real estate market and household budgets in Europe
The NIQ report 'Purchasing Power Europe 2026' reveals a structural change in the hierarchy of purchasing power on the continent, with Romania dropping to 32nd place in a top list of 42 European states, with an estimated disposable income of €11,283 per inhabitant. This sum equals approximately 53% of the European average of €21,153, marking a loss of one position compared to the previous edition of the ranking. At the European level, average purchasing power grew nominally by 4.4% compared to the previous year, reaching €21,153 per person, with the total sums available for expenditure and savings of the European population estimated at €14.5 trillion. [3]
Romania exhibits one of the most acute internal divisions regarding incomes. The Bucharest-Ilfov region records a purchasing power of €22,941 per inhabitant, a level double the national average of €11,283. The capital manages to cross the European threshold; Bucharest is the only administrative-territorial unit in Romania that exceeds the EU average of €21,153 per person, consolidating its status as a major economic hub. The European purchasing power index calculated for Bucharest is 108.5, exceeding the continental standard. The national index, which measures deviation from the country's average, reaches 203.3, clear proof that income in the capital is more than twice the national average. [3]
In the internal hierarchy, after Bucharest, the counties of Cluj, Ilfov, and Timiș record the highest national index values, followed by Sibiu, Brașov, Prahova, Argeș, and Constanța. In total, these nine counties and the Bucharest metropolitan area constitute the only points of resonance above national averages. The transition to the area below the country's average is easy, with Alba occupying 10th place in the internal ranking with a national index of 99.3, signifying that the threshold of the national average is extremely tight around this group of developed areas. The abyss between the top and bottom of the national ranking is visible in absolute numbers. Besides Bucharest, which records €22,941, the Giurgiu county reaches only €5,816 per inhabitant, highlighting a strong development gap within the borders. The value discrepancy reaches €17,100 between the capital and Giurgiu, purchasing power in Bucharest being nearly four times higher. This regional fracture indicates an extreme concentration of available financial resources. [3]
Update
Housing crisis and purchasing power: A comprehensive approach to the real estate market and household budgets in Europe
NIQ's 2026 research draws attention to the dynamics of the real estate market, with Europeans' purchasing power growing nominally by 4.4% to €21,153 per capita. Bulgaria ranks 23rd in the European purchasing power ranking. Romania drops from 31st to 32nd place, with €11,283 per capita. [4]
Update
Romania drops to 32nd place in the European purchasing power ranking
Romania falls to 32nd place in the European purchasing power ranking, with an estimated disposable income of €11,283 per capita in 2026, according to the NIQ study 'Purchasing Power Europe 2026'. This sum represents approximately half of the European average, which rises to €21,153 per capita. Internal disparities remain acute; Bucharest exceeds the European average with an index of 108.5, while Giurgiu county records only €5,816. [5]
Update
Romania drops to 32nd place in the European purchasing power ranking
According to the NIQ study 'Purchasing Power Europe 2026', Romania occupies 32nd place out of 42 European countries in the purchasing power ranking, dropping one position from 2025. The national average disposable income is estimated at €11,283 per capita, representing approximately 53% of the European average of €21,153. [6]
The Bucharest-Ilfov region significantly distances itself from the rest of the country, with a purchasing power of €22,941 per capita. This makes the capital the only administrative unit in Romania that exceeds the European average, with a European index of 108.5. The model of concentrating incomes in capitals is specific to other European regions as well. In France, Paris records €46,366 per capita, approximately 80% above the national average, while Bratislava, Sofia, Prague, Budapest, and Lisbon exceed their respective countries' averages by at least 25%. However, there are also notable exceptions, such as Berlin (€30,178, below the German average) or Brussels, where the local level is approximately 10% below the national average. The NIQ analysis emphasizes that purchasing power is an indicator of post-tax and post-contribution disposable income, complemented by social benefits. This reflects the financial potential of households for current expenditures, savings, and investments, covering the full spectrum of daily needs. [6]
The internal structure of purchasing power in Romania is marked by strong polarization. Only nine counties and the capital record national indices above the average, while Alba already occupies 10th place with an index of 99.3, slightly below the national threshold. The gap between the richest region (Bucharest, €22,941) and the poorest (Giurgiu, €5,816) reaches €17,100, with the capital's residents having nearly four times higher purchasing power. Raluca Mănărcescu, NIQ Geomarketing expert, commented on current trends: 'With a 4.4% growth, purchasing power in Europe continues to advance noticeably in 2026. It is worth noting that numerous markets in Central and Southeast Europe continue to develop more dynamically than a large part of Western Europe.' Disparities at the European level remain visible. Liechtenstein, Switzerland, and Iceland remain at the top of the ranking, while Ukraine, Kosovo, and the Republic of Moldova are at the opposite pole of the hierarchy. The total budget for purchasing power for the 42 evaluated states is estimated at €14.5 trillion. Investments and expenses: Consumers use their disposable income for housing, energy, food, transport, insurance, private pensions, and holidays, demonstrating diverse economic absorption capacities depending on the region. NIQ expert Raluca Mănărcescu highlighted European dynamics: 'Mature markets in Western Europe remain among the most important consumer markets in Europe due to high levels of purchasing power and their size.' Although differences between countries are gradually reducing, market potential varies significantly. At the European level, only 17 countries exceed the continental average of €21,153, with the remaining 25 states below this threshold, highlighting development inequalities. The total sum available for expenditure and savings is estimated at €14.5 trillion. This value represents a nominal increase of 4.4% compared to the revised period of the previous year. Definition of purchasing power NIQ, according to the study, targets nominal post-tax and post-contribution disposable income, including social benefits. Values are not adjusted for inflation. Spending areas, purchasing power is used for food, housing, energy, mobility, private pensions, holidays, and purchases of consumer goods. [6]
Update
Romania falls to 32nd place in the European purchasing power ranking
Romania occupies position 32 in a top list of 42 European states, according to the NIQ study 'Purchasing Power Europe 2026', dropping one position compared to the previous edition. The total sums available for expenditure and savings of the European population are estimated at €14.5 trillion, reflecting a nominal increase of 4.4% compared to the previous year. This growth marks a relative stabilization of the global indicator, even though Europeans' purchasing power rises to €21,153 per capita. [7]
The average disposable income for every Romanian is estimated at €11,283, a value representing approximately half (53%) of the European average of €21,153. Although the national average is low, Bucharest significantly distances itself from the rest of the country, reaching a purchasing power of €22,941 per capita, almost double the national average and above the continental threshold. Thus, the capital becomes the only administrative-territorial unit in Romania that exceeds the European average, registering a European index of 108.5. The internal ranking reveals an extreme concentration of resources: only nine counties and the capital register national indices above the national average. After Bucharest, follow Cluj, Ilfov, and Timiș counties, as well as Sibiu, Brașov, Prahova, Argeș, and Constanța. The national average threshold is hard to reach; Alba occupies tenth place with a national index of 99.3. The discrepancy between the top zone, Bucharest (€22,941), and the bottom zone of the ranking, Giurgiu county (€5,816), reaches €17,100, with capital residents having nearly four times higher purchasing power than those in Giurgiu. The model of concentrating incomes in European capitals is generalized: Paris records €46,366 per capita, approximately 80% above the French average. Similarly, Bratislava, Sofia, Prague, Budapest, and Lisbon exceed their respective countries' national averages by at least 25%. However, the existence of some exceptions demonstrates that regional harmonization is possible. Berlin records a purchasing power of €30,178, placing it over €1,000 below the German average (€31,193). Similarly, in Brussels, the local level is approximately 10% below the national average. [7]
Polarization is visible also at the European level. Southern Poland is led by Liechtenstein (€78,520 per capita), followed by Switzerland (€54,730) and Iceland (€44,692). Norway climbs spectacularly to fifth place, with €35,947. The opposite pole of the classification is occupied by Ukraine, with a disposable income of €3,456 per inhabitant; the last places are occupied by Kosovo and the Republic of Moldova, highlighting major economic inequalities. In the European top, the biggest position changes compared to the previous year are noted for Norway (which rose from 10th to 5th) and Luxembourg and Iceland, which swapped ranks occupying 4th and 3rd place respectively. Only 17 countries exceed the continental average, while the remaining 25 states, including Romania, fall below this threshold. Raluca Mănărcescu, NIQ Geomarketing expert, states: 'With a 4.4% growth, purchasing power in Europe continues to advance noticeably in 2026. It is worth noting that numerous markets in Central and Southeast Europe continue to develop more dynamically than a large part of Western Europe. At the same time, mature markets in Western Europe remain among the most important consumer markets in Europe due to high levels of purchasing power and their size. Although differences in purchasing power between European countries are gradually reducing, market potential continues to vary significantly across the continent.' [7]
Update
Romania, at 32nd place for purchasing power in Europe. Large disparities between the Capital and poor counties
Romania occupies 32nd place in a top list of 42 European states, with an estimated disposable income of €11,283 per inhabitant in 2026. This sum is equivalent to approximately 53% of the European average of €21,153. At the national level, regional disparities remain accentuated: the Bucharest-Ilfov region records a purchasing power of €22,941, while Giurgiu county reaches only €5,816. The NIQ report 'Purchasing Power Europe 2026' analyzes disposable incomes from 42 European states. The European average rises nominally by 4.4% to €21,153, with the total sums available for expenditure and savings estimated at €14.5 trillion. Romania dropped one position compared to the previous edition, moving from 31st to 32nd in the purchasing power ranking. The average disposable income of €11,283 per person represents slightly over half of the European average of €21,153. The NIQ indicator represents the nominal annual income remaining after paying taxes and contributions, including state benefits. Sums are not adjusted for inflation. The European ranking is led by Liechtenstein, with a disposable income of €78,520 per inhabitant, a value approximately 3.7 times higher than the continental average. Switzerland occupies second place (€54,730), and Iceland third (€44,692). Luxembourg is fourth (€43,840), and Norway climbs spectacularly to fifth place (€35,947), gaining five positions. In the top ten, we also find Denmark (€34,344), Ireland (€31,930), Austria (€31,454), Germany (€31,193), and the United Kingdom (€29,921). The opposite pole of the hierarchy is occupied by Ukraine (€3,456), Kosovo, and the Republic of Moldova. Ukraine occupies the last position, with a disposable income representing approximately 16% of the European average. Of the 42 countries analyzed, only 17 exceed the European average of €21,153, with the remaining 25 falling below this threshold, accentuating development inequalities. In Central and Eastern Europe, Romania ranks behind states such as Hungary and the Czech Republic. Hungary rose from 30th to 27th place, with €15,105 per capita, and the Czech Republic gained two positions, taking 21st place, with €17,785. Disposable income in Hungary is approximately 34% higher than in Romania. In the case of the Czech Republic, the difference reaches approximately 58%. The value recorded by Romania is almost half of the European average and less than a third of the disposable income in Liechtenstein. [8]
Internal differences in Romania are just as significant as those between European countries. Bucharest has the highest disposable income, €22,941 per capita, more than twice the national average. The capital exceeds the European average of €21,153 by approximately 8%, being the only administrative-territorial region in Romania to cross this threshold, according to NIQ data. Bucharest's index relative to the national average is 203.3, meaning the indicator's value in the Capital is over 100% higher than the country's average. After Bucharest, the highest national index values are recorded in Cluj (153.1), Ilfov (152.3), and Timiș (146). Followed by Sibiu (124.9) and Brașov (122). Prahova (103.6) and Argeș (103.4) also exceed the national average, as does Constanța (101.8). Alba occupies 10th place with an index of 99.3, slightly below the country's average. Only nine counties and the Bucharest metropolitan area constitute points of resonance above national averages, indicating an extreme concentration of financial resources. [8]
At the opposite pole from the Capital is Giurgiu county, where the average disposable income is only €5,816 per inhabitant. The difference from Bucharest reaches approximately €17,100 per person. Disposable income in the Capital is nearly four times higher than that recorded in Giurgiu. The model of concentrating incomes around the Capital is also found at the European level. In France, the Paris region has a disposable income of €46,366, approximately 80% above the national average. In Bratislava, Sofia, Prague, Budapest, and Lisbon, incomes exceed the national average by at least 25%. There are also different situations. Berlin records €30,178, below the German average (€31,193). In Brussels, disposable income is approximately 10% lower than the national average, suggesting alternative models of wealth distribution. [8]
The NIQ study also compares the total volume of available incomes in major European metropolitan regions. Île-de-France, the region surrounding Paris, leads the ranking with approximately €396 billion. The next positions are held by Lombardy (€272 billion) and the Istanbul metropolitan region (€227 billion). Differences depend both on individual income levels and on population. Île-de-France and Lombardy have disposable incomes of over €25,000 per person. Istanbul has a comparable total volume due to its large population, although individual disposable income is €14,411. Population size and income levels make these regions important markets for merchants and companies planning investment and expansion strategies. Raluca Mănărcescu, NIQ Geomarketing expert, emphasized that numerous markets in Central and Southeast Europe continue to record faster developments than some Western European economies. 'With a 4.4% growth, purchasing power in Europe continues to advance noticeably in 2026. It is worth noting that numerous markets in Central and Southeast Europe continue to develop more dynamically than a large part of Western Europe,' declares Raluca Mănărcescu. Mature economies in Western Europe remain important consumer markets due to high incomes and their size. Differences between European countries are gradually reducing, but market potential continues to vary considerably. [8]
The 'NIQ Purchasing Power Europe 2026' study measures annual disposable income per inhabitant, after deducting mandatory taxes and contributions and including state benefits. The indicator shows the average sum remaining to a person for expenditure and savings. This money can be used for housing, food, services, energy, insurance, private pensions, transport, holidays, and other purchases. The analysis covers 42 European countries and includes data at the regional, municipal, and postal code levels, as well as information on population and households. Values are expressed nominally in euros, not adjusted for inflation or price differences between countries. Calculations are based on income data, benefit statistics, and economic forecasts. [8]
Update
Romania drops to 32nd place in the European purchasing power ranking. NIQ Study
According to the NIQ study 'Purchasing Power Europe 2026', Romania has dropped to 32nd place in a top list of 42 European states, with an estimated disposable income of €11,283 per inhabitant in 2026, representing approximately half of the European average. The analysis is based on income data, social statistics, and economic forecasts, consolidating the purchasing power hierarchy at the continental level. [9]
Internal disparities remain acute, with Bucharest exceeding the European average by an index of 108.5, while Giurgiu county records only €5,816. The NIQ report 'Purchasing Power Europe 2026' analyzes disposable incomes from 42 European states. The data appear in the study 'NIQ Purchasing Power Europe 2026', which analyzes the disposable incomes of the population from 42 European states and highlights differences between countries and regions. At the European level, average purchasing power grew nominally by 4.4% compared to the previous year, reaching €21,153 per person. The total sums available for expenditure and savings of the European population are estimated at €14.5 trillion. Romania dropped one position compared to the previous edition of the ranking, moving from 31st to 32nd, confirming major divergences within the country. [9]
Hungary rose from 30th to 27th place, with €15,105 per capita, and the Czech Republic gained two positions, taking 21st place, with €17,785. Disposable income in Hungary is approximately 34% higher than in Romania, and the difference in the Czech Republic reaches approximately 58%. Of the 42 countries analyzed, only 17 exceed the European average of €21,153, with the remaining 25 falling below this threshold, accentuating development inequalities. [9]
Bucharest is the only city in Romania that exceeds the European average, reaching a purchasing power of €22,941 per capita. Purchasing power in the Capital is more than twice the national average of €11,283 and approximately €1,800 above the European average, consolidating its status as a major economic hub. The national index reaches 203.3, clear proof of the extreme concentration of financial resources. [9]
At the opposite pole is Giurgiu county, where purchasing power is only €5,816 per capita. The difference between Bucharest and Giurgiu exceeds €17,000 per year, meaning that Capital residents have, on average, nearly four times higher purchasing power than those in Giurgiu county. Only nine counties and the Bucharest metropolitan area constitute the only points of resonance above national averages. Alba, located 10th in the internal ranking, is already slightly below the country's average, with an index of 99.3. [9]
Liechtenstein remains first in Europe, with a purchasing power of €78,520 per capita, 3.7 times above the European average. Followed by Switzerland (€54,730) and Iceland (€44,692). Norway records one of the most significant ascents, rising from 10th to 5th place, with €35,947 per capita. The opposite pole of the classification is occupied by Ukraine, with a disposable income of €3,456 per capita; the last places are occupied by Kosovo and the Republic of Moldova, highlighting major economic inequalities. [9]
The model of concentrating incomes in capitals is generalized: Paris has an income of €46,366, approximately 80% above the French average, while Berlin is below the German average (€30,178 compared to €31,193). [9]
The NIQ study measures the population's disposable income after paying taxes and mandatory contributions, including benefits granted by the state. From this money, people must cover all expenses: food, housing, energy, transport, services, holidays, or savings, reflecting real economic absorption capacity. The figures do not represent the average salary nor the money remaining to people after paying bills. The values are nominal, without adjustment for inflation or price differences between countries, providing a snapshot at a given moment. The information in this paragraph is not related to the central subject of purchasing power and the NIQ analysis. [9]
Update
Housing crisis and purchasing power: A comprehensive approach to the real estate market and household budgets in Europe
Romania occupies 32nd place in a top list of 42 European states in the 2026 purchasing power ranking. For the first time, Vaslui is no longer considered the poorest county in Romania, a status taken over by Giurgiu. The NIQ study highlights the major discrepancy between income in Bucharest and the rest of the country as a defining factor of Romania's positioning on the European purchasing power map. Market research company NielsenIQ analysts emphasize that although concentrating wealth in capital cities is a trend observed in many European states, Romania presents a special and accentuated form of this phenomenon. Bucharest significantly distances itself from the rest of the country, with a purchasing power of €22,941 per capita, exceeding the European average of €21,153. It is the only county to exceed this threshold, having a value more than twice the national average of €11,283. Beyond the capital, only eight other counties record indices above average, while Alba sits immediately below the national threshold. NielsenIQ calculates a considerable difference between the most extreme internal development levels: Bucharest records €22,941, while Giurgiu reaches only €5,816. This disparity means that Bucharest residents have spending availability nearly four times higher than those in Giurgiu, the last administrative unit in the ranking. In 2026, for the first time, Vaslui county no longer occupies the last place in the purchasing power ranking; the status of the poorest region is taken over by Giurgiu county. [10]
Update
Vaslui, 'dethroned' by Giurgiu in Romania's purchasing power ranking
In 2026, Vaslui county was 'dethroned' from the position of the poorest county in Romania, according to analyses by the market research company NielsenIQ regarding purchasing power. This change marks a discontinuity in a long period during which Vaslui appeared constantly as the lower extreme, alongside Bucharest as the upper extreme. The internal structural change is confirmed by data placing Giurgiu in last place in the national ranking, with a purchasing power of €5,816 per capita. This value is almost four times lower than that recorded by Bucharest, the only county exceeding the European average. Bucharest maintains its status as the dominant area, with €22,941, a purchasing power more than twice the national average. Beyond the capital, only eight other counties record indices above average, while Alba is situated immediately below the national threshold, highlighting the concentration of financial resources in a restricted number of administrative units. NielsenIQ analysts observe that although concentrating wealth in capital cities is a general trend in many states, Romania stands out for the intensity of this phenomenon. The value difference between Bucharest and Giurgiu reflects a significant regional fracture, characteristic specifically of the Romanian market in the European context. The real economic absorption capacity of the Capital's residents is nearly four times higher than that of those in the county placed last. This gap highlights internal development inequalities that persist even under conditions of increased purchasing power at the European level. The change of last place in the national ranking from Vaslui to Giurgiu is an indicator of the relative dynamics of internal disparities. Although both counties fall within the area below the national average, the reassessment of the final position indicates an adjustment in the degree of relative poverty in certain regions, without changing the major polarization towards Bucharest. The contrast between Bucharest and the rest of the country remains the defining element of Romania's positioning on the European purchasing power map. The publication date and new details regarding the change of last place (Vaslui -> Giurgiu) are highlighted in this context. Although many European states present a similar concentration of incomes in main urban centers, Romania stands out for the amplification of this model. Analysts emphasize that this national particularity directly influences the perception of internal economic performance, independent of positive continental trends. [11]
Update
Regional and extreme disparities in purchasing power in Europe
The NIQ analysis reveals pronounced economic differences in Europe, with residents of Liechtenstein, Switzerland, and Iceland having incomes much higher than the continental average, while the lowest level of purchasing power is recorded in Ukraine, Kosovo, and the Republic of Moldova, which occupy the last three positions in the hierarchy of 42 evaluated states. Romania dropped one position in the last year, stabilizing at 32nd place in the European purchasing power ranking, confirming relative stagnation compared to neighbors who advanced. Liechtenstein remains at the top of the hierarchy, with a purchasing power of €78,520 per inhabitant, followed by Switzerland (€54,730) and Iceland (€44,692). Norway records the most significant ascent, rising from 10th to fifth place, with €35,947 per capita. The opposite pole of the classification is dominated by Ukraine, which occupies the last place with a disposable income of only €3,456 per capita, representing approximately 16% of the European average of €21,153. [12]
The Republic of Moldova presents a significant internalization of purchasing power. Residents of the municipalities of Chișinău and Bălți benefit from a disposable income approximately 20% above the national average. On the other hand, rural regions and small towns, such as Taraclia, Cahul, and Vulkănești, register indicators between 80% and 96% of the country's average, while vast internal zones fall below the 80% threshold, defining regions of poverty and deprivation. Cumulatively, the total budget for purchasing power for the 42 analyzed European states reaches approximately €14.5 trillion in 2026. These resources are allocated to various domains: acquisition of housing, consumption of goods and services, payment of energy, transport, savings for pensions, and leisure activities. The nominal growth of purchasing power at the European level is 4.4% compared to the previous year, reaching an average of €21,153 per person. Although the global indicator stabilizes, the volume of disposable income for consumption and savings continues to vary dramatically from country to country. [12]
Update
Purchasing power in Europe rises to €21,153; Romania, at 32nd place, with initial international disparities
The 'NIQ Purchasing Power Europe 2026' study, presented on Wednesday, reveals a nominal growth of 4.4% in purchasing power in Europe, reaching an average of €21,153 per capita, with an aggregate total of €14.5 trillion for the 42 states analyzed. Liechtenstein leads the ranking with €78,520, followed by Switzerland and Iceland, while Norway records the most significant ascent, rising from 10th to fifth place. Ukraine remains at the opposite pole, with €3,456, followed by Kosovo and Moldova. Raluca Mănărcescu, NIQ Geomarketing expert, emphasizes the dynamics of markets in Central and Southeast Europe and the importance of mature markets in the West, despite the gradual reduction of differences. [13]
Romania drops to 32nd place in the European top, with a disposable income of €11,283 per capita, approximately 53% of the continental average. Internal disparities are extreme: the Bucharest-Ilfov region records €22,941, exceeding the European average and being the only administrative-territorial unit in the country with this status. Bucharest's national index is 203.3, while Giurgiu county is in last place with €5,816, the difference reaching €17,1300. For the first time, Vaslui is no longer the poorest county; the status is taken over by Giurgiu. [13]
- Categories:
- Economy
- Entities:
-
- Paris
- Irlanda
- Sofia
- Marea Britanie
- Luxemburg
- Germania
- Alba
- Giurgiu
- Argeș
- Constanța
- Timiș
- Lisabona
- Budapesta
- Cehia
- Austria
- Bruxelles
- Sibiu
- Ucraina
- Norvegia
- Republica Moldova
- Ungaria
- Ilfov
- Prahova
- Cluj
- Republica Cehă
- Danemarca
- Moldova
- Elveţia
- Praga
- Islanda
- Bratislava
- Kosovo
- Liechtenstein
- NIQ
- Raluca Mănărcescu
- NIQ Purchasing Power Europe 2026
- NIQ Geomarketing
- NIQ Geomarketing
- NIQ Purchasing Power Europe 2026
- Nielseniq
- Vaslui
- Purchasing Power Europe 2026
Sources
- Bursa Raport NIQ: Puterea de cumpărare plasează România pe locul 32
- Evenimentul Zilei România s-a prăbușit în clasamentul puterii de cumpărare din Europa. Bucureștiul are de două ori media națională
- AGERPRES Puterea de cumpărare a europenilor crește la 21.153 euro în 2026; în România aceasta este de 11.283 euro (studiu)
- observatornews.ro Puterea de cumpărare a românilor, de 2 ori mai mică decât media europeană. Capitala, peste pragul european
- Forbes România Puterea medie de cumpărare în România ajunge la aproximativ 11.300 de euro în 2026
- Ziarul Financiar România coboară un loc în clasamentul european al puterii de cumpărare, pe poziţia 32, din 42 de ţări. Medie naţională este de 11.283 euro, 53% din media europeană. În Bucureşti, media este dublă, de 22.941 euro pe locuitor
- Economica.net Puterea de cumpărare a românilor este de 1,8 mai mică decât media europeană. Suntem pe locul 32 în Europa, după ce am pierdut o poziție. STUDIU
- Adevărul Câți bani le rămân românilor după taxe. Diferența uriașă dintre Capitală și cele mai sărace județe
- SpotMedia România pierde teren în clasamentul european al puterii de cumpărare. Cât au de cheltuit românii față de unguri și cehi. Diferențe uriașe între București și restul țării
- Ziarul Financiar Cum se remarcă România pe harta puterii de cumpărare din Europa? Discrepanţa dintre Bucureşti şi restul ţării iese în evidenţă
- Ziarul Financiar Vasluiul a fost „detronat” din poziţia de cel mai sărac judeţ din România? Ce judeţ e acum codaş când vine vorba de puterea de cumpărare a locuitorilor săi?
- Logos Press Moldova a devansat Ucraina în ceea ce privește puterea de cumpărare a populației, dar nu cu mult
- stirileprotv.ro Studiu: Puterea de cumpărare a europenilor crește la 21.153 de euro în 2026. În România, aceasta ajunge la 11.283 de euro